As a service to its members and the larger business community, IAB compiles and makes available highlights of research from leading market research organizations that identify trends, offer insights and advice, and illuminate the interactive advertising industry. Please note that IAB does not analyze the data for accuracy or reliability nor do we take responsibility for the findings. Use appropriate sourcing and fact-checking when applying this data for business use.
Browse from any of our libraries below for case studies, research, and more.
Attribution & Measurement
The Effectiveness of Brand Messaging in Driving Sales Incrementality
Facebook | February 2021
Is brand marketing on Facebook truly at odds with direct response (DR)? Or can the two work in tandem to help advertisers achieve both short- and long-term goals? To find out, Facebook teamed up with Analytic Partners and GroupM to examine the Marketing Mix Model (MMM) results of more than 500 Facebook brand and DR U.S. campaigns. Contrary to the assumption that only lower-funnel approaches help to achieve short-term goals, the MMM analysis found that both brand and DR advertising campaigns on Facebook are consistently effective in driving sales.
4 Strategies to Adapt Your Ad Measurement During Challenging Times
Facebook | 2020
Determining Consumer Intent for Automotive Dealership Visits
Placed | 2018
In the automotive industry, it is often difficult for companies who pay for advertising to get lower-funnel metrics based on consumer behavior in the physical world. As a result, automotive advertisers may be blocked from planning and optimizing campaigns for the shopping behavior they want to drive. By using offline attribution, this hurdle is overcome by advertisers who now leverage offline visitation as a lower-funnel performance metric for analyzing and optimizing automotive campaigns.
Benchmarks
U.S. Video Benchmarks Report: Fall 2020 Edition
Innovid | 2020
Ready or not, 2020 has pushed us into the streaming-first era. Connected TV has reshaped the media landscape, but what does this ultimately mean for advertisers who need to incorporate this growing channel into their larger omni-channel strategies? A lot has happened over the last 90-days and we’ve collected some of the major trends, challenges, opportunities, and benchmarks.
2020 Q2 Video Benchmarks
Extreme Reach | 2020
As the pandemic continued into Q2, so did its impact on the video advertising ecosystem, shows the Q2 Video Benchmarks Report from Extreme Reach. Metrics from ER’s AdBridge platform reveal that following a distinct drop in Q1, the share of video impressions served to connected TV (CTV) platforms rose to 40 percent in Q2. That increase brought the proportion of impressions closer to the levels seen throughout 2019. The share of video impressions served to mobile and desktop remained strong, suggesting that multi-occupant households continued to split viewing across devices.
2020 Q1 Video Benchmarks
Extreme Reach | 2020
Q1 2020 Video Benchmarks from Extreme Reach show that the CTV share of total video ad impressions dropped to its lowest point in two years, an anomaly in a steadily rising trend. New data for April and early May, however, reveal a rapid rise in the CTV share of impressions back to the dominant levels pre-pandemic. The report also looks specifically at Q1 trends in DTC video advertising. The full report can be found at the link above.
Q4 and Full Year 2019 Video Benchmarks
Extreme Reach | 2020
Extreme Reach’s Q4 and full year video benchmarks report, based on video ads served from the AdBridge™, reveals that video ad impressions on CTV tripled in just two years. The 2019 full year video benchmarks highlight the rapid transformation of digital advertising driven by streaming and ad-supported video on demand.
The report also shows that in 2019 premium publishers were still preferred over media aggregators, 30-second ads regained the lead over 15-second spots, media aggregators showed strength in key metrics, and more. ER’s data tracks ad performance from a diverse set of brands across a range of categories and also shines a light specifically on DTC brands.
Q3 2019 Video Benchmarks
Extreme Reach | 2019
Extreme Reach’s Q3 2019 report, based on video ads served from AdBridge™, reveals relatively stable trends this year in how marketers are using digital video to build business. Our data tracks ad performance from a diverse set of brands across a range of categories and also shines a light specifically on the auto and DTC verticals. 2019 is shaping up to be a defining year for the video advertising landscape, marked by following consumer to connected TV, an embrace of the value of premium content adjacency, and a return of the good old 30-second ad for brand storytelling as streaming wars heat up. Among key findings, the study revealed that CTV has seen an increase of 34% since this time last year and continues its upward trajectory.
Q2 2019 Video Benchmarks
Extreme Reach | 2019
With New Insights on Automotive and Direct-to-Consumer Categories, Q2 Video Benchmarks Report Shows Strength of Premium Publishers for DTC Brands while Autos Lag Behind in Adoption of CTV.
Connected TV (CTV) has established itself as a brand building essential that is clearly here to stay. It now accounts for a full 50% of all video ad impressions–twice that of mobile–according to the latest Video Benchmarks report from Extreme Reach (ER), the complete asset management solution for TV and video ads. This marks the fifth consecutive quarter that CTV has outranked mobile in the number of impressions served by device.
ER’s quarterly Video Benchmarks reports are based on data from the company’s AdBridge™ platform, and specifically its video ad server. The data is used to track emerging trends through a range of metrics, including video ad completion and viewability rates, and according to destination (i.e., premium publisher vs. media aggregator) and device (i.e., desktop, mobile, tablet and CTV). This latest version marks the addition of metrics for two advertising verticals: automotive and direct-to-consumer (DTC).
Q2 Digital Media Payments Report
Oarex | Q2 2019
Quarterly benchmark report of general payment trends, performance and history on dozens of companies paying ad revenue in the digital media eco-system.
Q1 2019 Video Benchmarks
Extreme Reach | 2019
This comprehensive report, based on the latest aggregate performance metrics from ER’s robust proprietary video ad server within AdBridge, shows 49% of video ad impressions going to CTV. Completion rates on CTV reached a new high in Q1 and longer ad lengths overall continued to rise.
Our industry-wide snapshot identifies emerging ad performance trends from a diverse set of brands across multiple categories. Viewer click-through, video ad completion and viewability rates, invalid traffic and time spent are all covered on these pages along with details on media destination (premium publisher vs. media aggregator) and device (desktop, mobile, tablet and connected television).
We introduce new metrics in this report for in-view and audible rates (p. 8) that shed light on how much of an actual ad can be seen or heard when the ad starts, when it stops, as well as the total duration in seconds.
Q4 and Full-Year 2018 Video Benchmarks
Extreme Reach | 2018
The Extreme Reach Video Benchmarks Report for Q4 and Full-Year 2018 shows that Connected TV ad impressions grew from 15% in Q4 2017, to 44% in Q4 2018—a stunning increase of 193%. ER also sees that CTV is having a halo effect on other areas, including increased average ad length and higher video completion rates for premium publishers.
This latest report, based on metrics from ER’s platform, AdBridgeTM, and specifically its proprietary video ad server, provides the strongest evidence yet that the migration of media consumption from linear TV to connected devices like Roku and Apple TV, as well as ad-supported streaming services such as Hulu, are enhancing advertisers’ ability to reach and engage audiences. Read the full report for a deeper dive into these and other emerging ad performance trends.
Q3 2018: Video Benchmarks
Extreme Reach | Q3 2018
The Extreme Reach Video Benchmarks Report for Q3 2018 shows that connected TV is the dominant ad platform, having overtaken mobile in Q2. Ads on CTV continue to have the highest performance rate and as a result 30-second spots are back in vogue. Premium publishers continue to yield higher performance than media aggregators.
The report tracks performance metrics for video ads served by Extreme Reach for major brands across multiple categories.
Q2 2018: Video Benchmarks
Extreme Reach | 2018
Extreme Reach’s Video Benchmarks Report for Q2 2018 reveals trends driven by increased cord-cutting and demands for trust and brand safety. The opportunity for advertising on Connected TV is growing, evidenced by CTV overtaking mobile in the percentage of video ad impressions served by device in Q2. Premium inventory drives higher viewability and completion rates. The report tracks performance metrics for video ads served from the Extreme Reach platform for major brands across multiple categories.
Q1 2018: Video Benchmarks
Extreme Reach | 2018
The Extreme Reach Video Benchmarks Report for Q1 2018 reveals positive trends in video advertising with completion rates at new highs and fraud rates at new lows. Premium publishers account for the majority of impressions served in Q1 at a rate of 71%, versus 29% for media aggregators.
Mixpanel Media & Entertainment Benchmarks Report
Mixpanel | April 2018
“What should I expect as an “average” session length?” “What’s a best-in-class conversion rate?” To answer these questions and more, we analyzed aggregated data from 3.5 billion users performing 66 billion events in hundreds of media & entertainment products from around the globe—and we had industry experts from NBC, Absolut Vodka, Univision, Carnegie Mellon, and more to weigh in. Looking at audio, gaming, video and written media products on Mixpanel, we found average and best-in-class benchmarks on web and mobile in four key metric categories: usage, retention, engagement and conversion. Download the free report to see if your products are as entertaining as the competition’s.
Mixpanel Product Benchmarks Report
Mixpanel | October 2017
“How do we stack up against the competition?” To find out, we looked at aggregated data from 1.3 billion unique users performing 50 billion events around the globe, across thousands of products. By analyzing this data on Mixpanel, we found average and best-in-class benchmarks in four popular industries for product innovation: financial services, media & entertainment, software-as-a-service (SaaS), and e-commerce & retail. Download the free report to see how digital products perform across industries.
Google Display Benchmarks Tool
Google | July 2017
Google’s Display Benchmarks tool lets you pull up-to-date industry benchmarks to help you better plan and measure the success of your display campaigns. Whether you’re after average expansion rates for automotive creatives, expected Rich Media interaction rates for retail creatives from France or just the average click through rate for Entertainment ads from the US, we hope that you’ll find this a truly useful resource and add it straight to your bookmarks bar.
Branded Content
Driving Efficient Purchase Intent with Branded Content and Brand Ads
Facebook | 2020
Seven Steps To Successful Branded Content
Reuters | 2018
Two thirds of global CMOs now believe that ‘marketing decisions should be based on how they impact the customer, rather than the business.’ This growing interest in the consumer brings an increased focus on content marketing and branded content.
Brand Safety
Brand Safety’s Technological Challenge: How Keyword Blacklists are Killing Reach and Monetization
CHEQ | September 2019
Advertisers, eager to mitigate brand safety risk, turned to ad verification solutions offering keyword blacklists as the primary solution. Advertisers today will upload lists ranging from 2,000 unsafe keywords and up to 4,000 in some cases. These lists are then used by verification partners as a filtration mechanism to detect and block harmful content containing those keywords. The problem is that hundreds of such keywords could easily be used within a perfectly safe context (e.g. Video “killed” The Radio Star), rendering the practice blunt and inaccurate. The full scale of the failure of keyword lists is laid out in this study, in which CHEQ found that nearly three-quarters (73%) of safe LGBT online news were denied ad dollars by brand safety blacklists.
Biometric Research: This is your brain on ads
Integral Ad Science, September 2019
IAS partnered with Neuro-Insight to conduct research into the connection between ad placement and consumer perception. By using technology that tracks and records brain activity, we found neurological evidence that ads viewed in high-quality environments are perceived more favorably than in low-quality environments.
Consumer Strategy
2020 Consumer Attitudes on Personalized Ads
Innovid | July 2020
2020 has turned our jobs, entertainment, and habits upside down to the point where marketers are relearning how to approach advertising in a world where things seem to change every day. To help, Innovid asked over 1,000 consumers about how they feel about personalized ads and put these insights into an interactive infographic.
Our findings explore:
- Sentiment toward personalized ads
- What types of ads capture consumer attention
- What content they are most likely to click on
- Consumer loyalty and purchasing behavior
Dimension 2018
Kantar Media | 2018
Kantar Media surveyed consumers and ran qualitative groups and interviews amongst industry leaders to identify major trends and exciting innovations shaping the world of media and communications planning. This report provides insights and guidance to brand owners, agencies, media owners and communications specialists, indeed to all whose role involves trying to reach and influence consumers.
Consumer Electronics Shopping Trends 2018
Criteo | April 2018
It’s not uncommon to find slick-looking user interfaces, well-run product demos, and exciting sales narratives when evaluating a data management platform (DMP), but don’t let those features distract from the elements needed for day-to-day and long-term strategic success of a DMP.
The Gen Z Report
Criteo | May 2018
Criteo surveyed thousands of members of Gen Z across the globe to find out what they think about shopping today, like what they want from the retail experience, what motivates them to buy, and more.
Consumer Electronics Shopping Trends 2018
Criteo | April 2018
It’s not uncommon to find slick-looking user interfaces, well-run product demos, and exciting sales narratives when evaluating a data management platform (DMP), but don’t let those features distract from the elements needed for day-to-day and long-term strategic success of a DMP.
The State of Customer Lifetime Value Report
Criteo | April 2018
From smartphones to refrigerators, consumer electronics (CE) shoppers do their product research across channels and devices. To better understand shopper behavior and influences, Criteo conducted a US survey of 2,500 buyers in key product categories to compile “The Criteo Shopper Story.” From there, the organization zeroed in on responses from the CE respondents to bring you “The Consumer Electronics Report 2018.” Criteo also analyzed the data from its Sponsored Products network of leading US retail sites to uncover all of the consumer electronics shopping trends in 2018 – learning how people shop and which electronics products they search.
COVID-19 Impact
Global State of Small Business Report
Facebook | December 7, 2020
On December 7, Facebook released the latest wave of its “Global State of Small Business Report”, which has been tracking since the shutdown began the economic and societal impact of COVID-19 on small businesses.
- According to the report: while nearly half of all firms surveyed reported a “significant impact” from the shutdowns occasioned by the latest wave of COVID-19, the industry that reported the highest impact was manufacturing, at 49%.
- Agriculture, farming, and mining industries have seen the fastest rebound, as impacts from the shutdown dropped from 44% to only 22%, in the latest wave.
- In keeping with previous findings however, the pandemic disproportionately impacted female business leaders: 31% of female business leaders surveyed spent more time on domestic tasks, compared to 26% of male business leaders.
- Finally, and fortunately, optimism about the future among business leaders has continued to increase across each successive survey wave. In the latest survey, 56% of respondents confirmed they were optimistic or very optimistic about the future of their business, up from 54% in Wave I.
White Paper: Understanding and Serving Consumer Needs during COVID-19 and Beyond
Experian | 2020
Beginning in February 2020, a global pandemic caused by the Coronavirus (AKA COVID-19) with no immediate vaccine has led to dramatic actions by public and private institutions. Almost immediately, consumers made significant lifestyle changes that impact how they shop, bank, seek healthcare and provide for their families.
To explore how organizations can pivot to accommodate these ever-changing consumer needs and concerns, Experian has published a white paper outlining the consumer audience segments, occupations and behaviors most impacted by COVID-19.
COVID-19 Consumer Sentiment Research
TrueX | 2020
The COVID-19 pandemic is changing how we live, work, and make decisions. For the advertising industry, that means reassessing our relationship with consumers. Using TrueX’s UP//LIFT survey technology built to assess the brand funnel impact of advertising campaigns, the organization is continually monitoring consumer sentiment and outlook in the wake of COVID-19 and what roles audiences want brands to play.
Creative
Breakthrough Brands 2020: Six Creative Behaviors for Driving Business Impact
Facebook | October 2020
What can we learn from breakthrough brands? Which creative strategies are innovative advertisers leveraging to build enduring connections and drive exceptional results?
To find out, Facebook’s Creative Shop analyzed some of the strongest recent campaigns on our platforms. This creativity focused, data-backed examination —part art and part science—revealed six key behaviors with measurable business impacts.
A framework for improving advertising creative using digital measurement
Facebook | April 2020
While creative is thought to be an important factor in advertising success, there is no clear industry consensus on how to quantify this impact or use it to identify creative best practice. This paper reviews industry literature that has broached this topic to date and provides a three-stage framework for how to approach the problem of creative testing and measurement. Firstly, the authors advocate for the identification of a creative attribution metric, to isolate the creative impact from other factors that impact campaign. Secondly, it serves to deconstruct creative into its component parts, to reduce complexity by limiting the levels of variation the researcher needs to account for. Domain knowledge should be applied to make decisions about which creative features might be both impactful and measurable. Finally, it is recommended that researchers uncover causal relationships between creative components and outcomes through RCTs at best and A/B tests at minimum. The paper concludes with two worked examples of this process for advertisers.
Cross-Device
Summer Travel Report 2018
Criteo | June 2018
Every day, Criteo records 600TB of shopper data created by the 1.4B monthly active shoppers in its data pool. This report identifies trends in summer travel globally and across devices.
7 Key Trends for the Travel Industry in 2018
Criteo | January 2018
This report analyzes trends in the travel industry across devices. After the gift-giving whirlwind of the holiday season, shoppers start to think about the next big thing: vacations. In fact, as Criteo analyzed data across its travel clients, the organization found that there is a significant spike in travel bookings right after December.
Data
Collaborative Data Solutions: Data and Identity in the Era of Permission
Winterberry Group & Wiland | 2021
With the depreciation of third-party cookies, increased concern about the provenance of third-party data, and evolving privacy regulations, digital marketers are looking at both familiar and evolving collaborative data solutions to compete in a rapidly-changing data landscape. This white paper from Winterberry Group explores a variety of ways for brands, agencies, publishers, and data providers to collaborate in the areas of sharing, protecting, activating, and monetizing privacy-compliant data assets.
As a Premier Sponsor of this paper, Wiland worked with Winterberry Group to offer their perspective. Curated from interviews with their executives and other data industry experts, this white paper analyzes:
- The market drivers making collaborative data solutions necessary
- How collaboration and the future of the market rely on permission
- The leading collaborative data solutions and their outlook
- Collaboration’s impact on the advertising and marketing ecosystems
Measure Marketing Effectiveness: A Guide to Implementing Incrementality
Facebook | 2019
Incrementality is the measure of the true value created by any business strategy, determined by isolating and measuring the results it caused, independent of other potential business factors. Incrementality is calculated by comparing differences in outcomes between two separate groups of people: those who’ve been exposed to the strategy and those who haven’t.
Unlock Business Growth with Incrementality Measurement
Facebook | 2019
Incrementality measurement is at the core of what advertisers need to know to justify their investments – how much business do I get when I spend money on advertising relative to how much business do I get when I don’t spend money on advertising.
Prepare for the Unexpected
Facebook | 2019
A Guide to Testing and Learning with Incrementality Measurement
The DMP Checklist: 7 Questions to Ask to Ensure a Solid Core
Oracle | 2018
It’s not uncommon to find slick-looking user interfaces, well-run product demos, and exciting sales narratives when evaluating a data management platform (DMP), but don’t let those features distract from the elements needed for day-to-day and long-term strategic success of a DMP.
Performance Marketing Actually Performs
MediaAlpha| 2018
Forrester research indicates that performance marketing enables marketers to gain deeper insights into how their campaigns directly impact business outcomes. The findings also show that performance marketing yields highest returns when bought programmatically instead of through costly, opaque ad networks.
Micro-Moments Now: 3 New Consumer Behaviors Playing out in Google Search Data
Google | July 2017
People’s search behavior is evolving and their expectations are becoming clear. Google’s VP of Marketing for the Americas Lisa Gevelber gives a glimpse of the consumer taking shape behind the data.
How to Build Brand Infatuation with Your Customers
Signal | June 2017
Creating true brand infatuation is a huge challenge in today’s fast-moving, digital world. It’s up to marketers to turn consumers not just into customers, but into loyal advocates. This new research study from Digital Ascendant and Signal shares insights about building brand infatuation gained from a survey of 500 U.S. consumers about their most beloved retail and travel/hospitality brands.
5 Reasons Your Brand Should Build Its Own Customer Data & Identity Asset
Signal | 2017
Marketers are now waking up to the harsh realities of giving their customer data away to resolve identity or leaving it trapped in a closed ecosystem. Saddled with fragmented customer views, incomplete measurement and no options to fully own customer relationships, many marketers are finding that building and maintaining long-lasting, loyal engagement is merely a pipe dream, turning their brand’s bottom line into a nightmare.
The Power of Insight
Oracle Marketing Cloud | 2016
Customers are telling you who they are in each and every engagement. But are they speaking a language you understand? Oracle Marketing Cloud puts data management at your fingertips, with a robust solution that empowers your team to turn conversations into valuable personalized interactions.
Digital Audio
Podcast Campaign Lift: A Guide to Accurately Analyzing Campaign Conversion Rates
Claritas | 2020
Does it pay off to invest in a podcast marketing campaign? Claritas analyzed the results of over 158 podcast campaigns in multiple industries and found lift significantly exceeding those of other channels. Claritas’ Podcast Campaign Lift Report also provides detailed insight into industry-by-industry benchmarks and “best practices” that allow podcast advertisers to more accurately analyze the effectiveness of their podcast and other multichannel marketing campaigns.
State of the Media: Audio Today 2017
Nielsen | June 2017
Marketers and brand managers are rediscovering radio. It’s a mass medium that can deliver targetability and message frequency in markets large and small. And as the audio pie continues to grow (Americans are carving out more and more time each day to listen), radio consumers tune in when and where it counts. Listening outside the home and, specifically, in the car is a huge part of the radio ecosystem. This gives advertisers the opportunity to uniquely deliver their message just prior to purchase.
Spotify Brand Impact Story
Spotify | January 2015
The Brand Impact Study was administered by comScore—a global leader in measuring the digital world and a preferred source for digital business analytics—and commissioned by Spotify for Brands—the platform that unlocks audience intelligence to connect brands with the streaming generation—to quantify the impact that music listening has on brands.
Digital Video
Q1 2021 Video Benchmarks
Extreme Reach | 2021
In Q1, 2021, the CTV share of impressions grew and 30-second ads reached an unprecedented high in Extreme Reach’s video benchmarks. 15-second ads hit an all-time low and premium publishers regained the lead over media aggregators. New to this report is a look at how aggregator and premium publisher impressions in Q1 break out by platform. The full report provides an industry-wide snapshot and identifies additional trends across performance metrics for video advertising.
The Year Streaming Went SUPERNOVA: Global Omni-Channel Benchmarks Report 2020
Innovid | April 2021
2020 upended the way we engage with content, and brands have had to adjust accordingly. As consumers flocked to their biggest (and smallest) screens, marketers followed suit and adapted their strategies to center around the home. Download Innovid’s Global Omni-Channel Benchmarks Report 2020 to see what their data revealed about video and display advertising trends in such an unprecedented year, and gain insights to guide your 2021 marketing strategy.
Report Highlights:
- Global CTV impressions increased 60% year over year
- Programmatic impressions served to CTV increased by over 200% year over year
- Advanced creative video formats generated a 309% lift in engagement. For display, dynamic creative generated a 37% lift in CTR over standard creative
2020 Q4 and Full-Year Video Benchmarks
Extreme Reach | 2021
Over the course of 2020, media aggregators earned a greater share of impressions than premium publishers — a first in ER’s benchmarks. See how impressions break down across devices, ad lengths and other key metrics for both Q4 and full-year 2020.
2020 Q3 Video Benchmarks
Extreme Reach | 2021
Metrics from ER’s AdBridge platform for Q3 2020 show the stability of CTV’s share of impressions and the continued dominance of 30-second ads. Desktop benefits as work from home continues, due to COVID-19, and the share of impressions served via media aggregators hit a new high in the quarter. The full report from Extreme Reach provides an industry-wide snapshot and identifies additional trends across performance metrics for video advertising.
It’s Time For Media Companies To Meet The Streaming Video Moment
PubMatic & Forrester | 2020
One of the biggest lessons of 2020 may be that consumers’ appetite for streaming content knows no limits. As we look forward, PubMatic has commissioned new research from Forrester Consulting to gauge the industry’s outlook for programmatic OTT in the year to come – giving practical insights and actionable data for publishers and buyers looking to reach consumers across this growing channel. The report dives into the OTT opportunity, the benefits of OTT advertising and current concerns in the space.
Innovid 2019 Global Video Benchmarks Report: A New Era of Personalization
Innovid | 2020
Innovid’s Global Video Benchmarks annual study is based on a yearlong analysis of Innovid-served campaigns, encompassing hundreds of billions of impressions from more than 600 advertisers. 2019’s report reveals a massive investment in connected TV as well as major growth in advanced creative usage across all channels.
Additional key findings include:
- Connected TV impressions dominate PC, signaling a seismic shift in how brands approach digital video
- Ways advanced creative experiences can drive customer engagement
- How ad length directly impacts ad performance
Innovid iQ Omnichannel Video Analytics Dashboard
Innovid | 2020
Culled from every campaign running across the Innovid platform, the Innovid iQ dashboard gives marketers a weekly view of the evolving video ad landscape as COVID-19 changes how consumers engage with digital video and CTV. On a weekly basis, the dashboard highlights key global trends and insights, uncovers overall volume growth by vertical, and shares week-over-week change by publisher.
Is All TV Attention Created Equal?
Roku | 2020
Roku partnered with TVision to better understand viewer attention, specifically how viewer attention on OTT is different than on linear. This one-pager summarizes their findings, incl how dayparts impact OTT viewing, performance differences between OTT and linear, and implications for buyers and sellers of OTT.
Q1 2019 Video Benchmarks
Extreme Reach | 2019
This comprehensive report, based on the latest aggregate performance metrics from ER’s robust proprietary video ad server within AdBridge, shows 49% of video ad impressions going to CTV. Completion rates on CTV reached a new high in Q1 and longer ad lengths overall continued to rise.
Our industry-wide snapshot identifies emerging ad performance trends from a diverse set of brands across multiple categories. Viewer click-through, video ad completion and viewability rates, invalid traffic and time spent are all covered on these pages along with details on media destination (premium publisher vs. media aggregator) and device (desktop, mobile, tablet and connected television).
We introduce new metrics in this report for in-view and audible rates (p. 8) that shed light on how much of an actual ad can be seen or heard when the ad starts, when it stops, as well as the total duration in seconds.
Q4 and Full-Year 2018 Video Benchmarks
Extreme Reach | 2018
The Extreme Reach Video Benchmarks Report for Q4 and Full-Year 2018 shows that Connected TV ad impressions grew from 15% in Q4 2017, to 44% in Q4 2018—a stunning increase of 193%. ER also sees that CTV is having a halo effect on other areas, including increased average ad length and higher video completion rates for premium publishers.
This latest report, based on metrics from ER’s platform, AdBridgeTM, and specifically its proprietary video ad server, provides the strongest evidence yet that the migration of media consumption from linear TV to connected devices like Roku and Apple TV, as well as ad-supported streaming services such as Hulu, are enhancing advertisers’ ability to reach and engage audiences. Read the full report for a deeper dive into these and other emerging ad performance trends.
Q3 2018: Video Benchmarks
Extreme Reach | Q3 2018
The Extreme Reach Video Benchmarks Report for Q3 2018 shows that connected TV is the dominant ad platform, having overtaken mobile in Q2. Ads on CTV continue to have the highest performance rate and as a result 30-second spots are back in vogue. Premium publishers continue to yield higher performance than media aggregators.
The report tracks performance metrics for video ads served by Extreme Reach for major brands across multiple categories.
Fixing TV’s Ad Model
Mirriad | 2018
With the growing trend of ad avoidance and ad-free services, the traditional TV ad model challenged, and the industry is looking to counter this with reduced ad loads. TV services will need to find a way to make advertising work with new, creative ways of thinking about the advertising model. A new survey by Mirriad finds that 81 percent of industry respondents said it’s important that networks improve consumers’ experiences with ads rather than simply cutting ad loads.
The Case for Ad Clouds in Video Advertising
Ad-ID | 2018
Video is rapidly becoming a ubiquitous medium. Once the stronghold of television sets and prime-time viewing, video content has escaped the confines of the living room television and may now be found on devices – and surfaces – of all sizes and forms. Make no mistake, video is still in the living room and a renaissance of high quality content is driving viewership to new levels. However, video is also in hands, on the road, at the checkout counter, at the gas pump, even on the sides of buildings – the list goes on. With this comes the opportunity for advertisers to engage audiences in new ways, reaching them with never-before-possible levels of precision and targeting and presenting them with compelling brand stories that resonate.
TV is Total Video
SpotX | 2018
A survey of 41 US-based MVPDs (multichannel video service providers), pure-play OTT providers, content owners, and advertisers reveals that changing patterns in how video is consumed haves resulted in significant shifts in their video advertising strategies. Overall, 80% of respondents agreed that the changing viewing habits had resulted in the requirement (or ability) to deliver cross-platform audience reach, with 100% of advertisers saying that this was the biggest resulting strategy change for them.
Travel & Tourism: How Digital Video is Changing Engagement
SpotX | 2018
Travel and tourism is one of the many industries that has been reshaped by technology. The emergence of the internet shifted work from travel agents and put travel planning squarely in the hands of the consumer. While consumers may still turn to travel agencies for exotic travel such as safaris, extended cruises, or cycling the Italian wine country, for the most part across the majority of leisure and business travel, consumers now choose to do their own planning and booking.
Total Video: The Economics and Marketplaces of Convergence
SpotX | 2018
Disruption in media has reached a point of normalcy. It’s impossible to read through the trade publications without coming across at least one feature on media companies investing in tech platforms, big-tech firms making plays for content, or whispers of studios eyeing the acquisition of distribution platforms. If you’re a seller or a buyer on the front lines of the TV or digital video business, it’s enough to make your head spin. Disrupting disruption would be the only thing truly disruptive to an industry whose longterm viability lies in simultaneously executing strategies of expansion and consolidation.
Auto Advertising How Digital Video is Driving the Industry
SpotX | 2018
The auto industry is legendary in the advertising arena. Legendary for its innovation, creativity, and sheer pervasiveness. Nowhere has this been more evident than video advertising. From major automotive manufacturers’ commercials for their newest models with elite production values, to dealer association ads that establish more personal messaging designed to drive consumer interest, to individual dealer videos that often become immensely recognizable in their local markets and get potential buyers into showrooms – automotive ads run the gamut from branding to direct response with a history of tremendous success. Over the years, the auto industry has been masterful in its ability to generate consumer interest and brand loyalty.
Field Guide To Mobile Video Advertising
SpotX | 2018
If you’ve been in the digital advertising industry for some time, you’ll remember hearing that ‘this is the year of mobile’ for more than a few years. In fact, a quick web search will find references to every year since 2007 being the year of mobile according to one media outlet, pundit or another. Looking back on the last 10 years, it’s pretty clear that while there may not have been any one particular year that mobile owned, with hindsight you can argue that this has been the ‘decade of mobile.’
The Current State of Sourcing and Preparing Creative Assets for Video Campaigns
ExtremeReach | Q1, 2018
This comprehensive report from Extreme Reach, based on research commissioned with Advertiser Perceptions™, illuminates just how cumbersome and inefficient it is for ad ops teams to find and prepare creative assets for video campaigns. In fact, 93% of ad ops professionals on the front lines of activation cite issues with sourcing and preparing assets, underscoring how vital it is that the industry address this issue. The most common issues cited were late starts, formatting errors, video quality degradation and missed ad calls.
Action-Hero Data Research
ExtremeReach | Q1, 2017
We live in a technology powered world. We hear “digital” and we think instant, real-time, automated and seamless. So, it’s ironic that teams can get a campaign live on linear TV in under an hour, but it takes days or weeks to get a digital video campaign ready to go. What’s wrong with this picture? We gave front line respondents* these word pairings and asked them to pick a point on the scale that most closely reflects how they see digital video activation.
Videology’s Q3 2017 U.S. TV & Video Market At-A-Glance
Videology | November, 2017
Infographic
Spending on linear TV campaigns in the Videology platform using advanced data grew 60% for the first three quarters of 2017, compared to the same time period last year. The report found that advanced linear TV spending is coming from an array of categories with Pharmaceutical, Travel and CPG ranking as the top categories spending the most on data-enabled TV in Q3 2017.
Vertical Video is on the Up and Up
YuMe | June 2017
Infographic
Vertical video is an ad and content format on the rise. It offers a natural experience within mobile and app content as the video is designed for upright, portrait mode viewing. YuMe’s study examines overall consumer preference for vertical video and receptivity as an ad format. The findings demonstrate that vertical video holds significant appeal for content viewing and offers a halo effect for brands: 65% of viewers say brands that use vertical video are more innovative.
Meet the New Movement in Mobile
AOL | May 2017
Infographic
This year, mobile is all about video. So what do marketers need to know in 2017? AOL has the insights to drive your next big moves. It’s time to hang up last year’s strategies and mindsets and catch up with consumer expectations. That means mobile-first, video-led, and good data applied every step of the way.
How Much is Enough: The Impact of Frequency on Video Advertising
YuMe | 2017
Increasing the frequency of exposure to online video ads can lead to stronger growth in brand awareness and consideration. Using Kantar Millward Brown’s MarketNorms® database, an analysis was conducted on almost 2,000 video advertising campaigns to understand the relationship between frequency and awareness and persuasion metrics.
Header Bidding: A Byte-Sized Overview
Videology | 2017
Header bidding is a way for a publisher to reach out to multiple demand sources simultaneously, before an ad call is served, to ask for bids. The publisher can then send the ad to the highest bidder among those queried, and therefore, theoretically produce greater yield. This Videology Knowledge Lab outlines everything you need to know about header bidding, especially as it relates to its use in the video advertising.
The Quarterly Barometer of the Industry
Year-End Insights: 2016
Freewheel | Q4 2016
2016 was a pivotal year for video. Smartphone and over-the-top (OTT) infrastructure are now at levels of critical adoption and broadband technology supports quality video experiences across platforms and throughout consumers’ lives. The year marked the announcement of several new internet TV packages while many publishers that were once print or display-only made very public efforts to focus heavily on video. As people spend more time every day with video, it is becoming an essential tool for digital publishers to build audiences and keep them engaged in an increasingly competitive landscape.
State of the Broadcast Industry 2017
Ooyala | 2017
Broadcasters are embracing a new reality as we charge into 2017. OTT video, which started as a vexing outlier, has not only been welcomed into the industry fold but is now driving mainstream broadcast strategies. Its hold on cord avoiders and its radical influence on technology, programming and advertising shifts is certain and can no longer be ignored.
Video Ad Streaming
ExtremeReach | January 2017
With digital video ad spend growth projected to be in the double digits for the foreseeable future, our industry has too much at stake to remain constrained by the current state of ad execution whose manual workflows create problems with version control, degraded quality, steep Talent & Rights penalties and more. Let’s adopt a streaming model and ensure that video campaigns are activated at the speed we’ve come to expect from programmatic buys.
The Extra Mile: 4 resolutions for Marketers from the top YouTube ads in 2016
Think with Google | December 2016
The most-watched YouTube ads of 2016 lend a few lessons. Here, Kate Stanford, director of YouTube ads marketing, shares what the best advertisers on YouTube did to go the extra mile and top the Year-End YouTube Ads Leaderboard. Consider these food for thought for your 2017 resolutions.
TV and Digital Video Evolve as Complementary Allies
Videology | March 2016
The way that consumers watch video content is in an ongoing state of upheaval. Counting on effectively reaching your customers on their couches during primetime is counting on missing many of them, as many viewers prefer to watch their shows at a different time and place of their choosing. When Videology first investigated these changes back in 2013, viewing was in an upheaval and the industry was aware but cautious. In an industry that is changing as rapidly as television and video viewing, two years is an incredibly long time.
Sizmek Rich Media and Video Benchmarks
Sizmek | H1 2016
Sizmek Research compiled key benchmarks like CTR, interactions, video starts and completes across a wide array of formats, verticals, and regions of the most important metrics advertisers need to know about for campaign performance. Sizmek Research analyzed 21 unique formats, more than 2,500 unique unit size combinations, over 1.3 million individual ads, and hundreds of billions of impressions served via the Sizmek platform during the first half of 2016 in order to compile Rich Media and Video Benchmarks H1 2016.
Online Video Advertising Effectives
Nielsen Media Lab Study Commissioned by HIRO | August 2016
How do you measure the effect of an online video ad? Engagement metrics (i.e. clicks, VTR and viewability) are easy to monitor and accurate, but the challenge with these digital KPI’s is that they are virtual in their very nature. You will know how many people saw your video ad but you cannot deduct from that how many people actually remembered the ad, liked the brand, and had an intention to buy. In other words, viewability and VTR are KPI’s and not an ROI. In this new Nielsen Media Lab Study that was commissioned by HIRO Media, we try to identify what predicts the effect of the ad and analyze new factors that prove to be more influential then the traditional engagement KPI’s.
The Shared Throne of Premium Video
FreeWheel Video Monetization Report | Q1 2016
Rapid ongoing evolution in our space has made it difficult for Programmers and Digital Pure-Plays to keep monetization efforts one step ahead of user behavior. In response to this challenge, it’s imperative that players in our space have a comprehensive understanding of these perpetual seismic shifts.
The Unrivaled Value of Premium Video
FreeWheel Council for Premium Video | April 2016
The complex, noisy world of digital advertising has become an increasingly challenging environment for brands to navigate. Growing numbers of advertisers are questioning whether they should be making the journey at all, contemplating reversing course and heading back to the familiar shores of traditional television. However, in stark contrast to the recent quality and transparency challenges often associated with some long-tail and exchange-purchased video, premium video represents a beacon of light that brands can rely on to safely find the audiences that will deliver the best outcomes.
Exploring New Video Ad Lengths
YuMe | May 2016
Shifts in the way people consume video content are changing how marketers strategize about video advertising. Increased consumption of snack-sized content, for example, has made shorter video ad formats more popular. To help address these questions, YuMe and IPG Media Lab, partnered to evaluate the effectiveness of different video ad lengths, looking at micro and longer form ad formats, devices and consumer perspective.
Unruly: The Lowdown: What Millennials Love, Hate and Want From Video Advertising
Unruly | May 2016
Unruly surveyed 3,200 people from around the world to learn what they love, hate, and want from video advertising. In this presentation, they shared a first look at findings from the Unruly Future Video Survey on what advertisers need to do (and not do) to engage audiences, with a special focus on Millennials. Filled with video case studies and new data, The Lowdown is an actionable playbook for creating respectful, engaging, and collaborative advertising experiences that benefit advertisers, publishers, and consumers alike.
Millward Brown: Ad Reaction: Video Creative in a Digital World
Millward Brown | May 2016
AdReaction Video examines audience behaviors around video consumption. As investment in video platforms by publishers and video creative by marketers continues to grow, it is essential to consider, global trends in video consumption, role of video platform and format in influencing advertising awareness and receptivity across devices, and principles for media investment and strategy to maximize effectiveness of video creative.
ShareThrough: The Millennial Perspective on Native Ads and the Mobile Content Experience
ShareThrough | May 2016
Millennials are more adverse to interruptive advertising and better at avoiding interruption than previous generations. Adjust your strategy by creating content that earns the attention of millennials through ads that fit in natively. This study will take you through millennial perceptions, attitudes, and interaction with native advertising, neuroscience research and insights about native ad effectiveness, and how brands use native video ads to capture consumer attention.
Ooyala Global Video Index
Ooyala | March 2016
Millennials are forcefully driving the action in digital video, as Ooyala Q4 report reveals. The Index has facts like these: 46% of all Q4 video plays were on tablets and smartphones; 69% of videos watched on smartphones were under 10 minutes long; and tablets rule in APAC — and their popularity keeps growing. Learn more in the Q4 Video Index.
Videology Q4 U.S. Video Market At-A-Glance
Videology | February 2016
According to an analysis of all impressions run through Videology’s platform in the fourth quarter, the number of U.S. video campaigns using TV audience data to target with digital video increased 114% year-over-year. The number one TV segment used in these campaigns was advertisers’ current TV advertising schedules. Combining TV data from sources like Nielsen with behavioral data, advertisers are amplifying their TV spend to reach consumers digitally across all devices.
Innovid 2016 Global Video Benchmarks
Innovid | February 2016
Innovid’s Video Marketing Platform has thousands and thousands of pre-roll and advanced video campaigns from the past year that help set the standard for what to expect with your video results. Innovid compiled all of their annual data and performance metrics from awareness, completions, engagement and time earned on video campaigns across various publisher placements and ad lengths. But this year, they’ve added more detailed data on video campaigns across connected TV, mobile, and desktop to show the power of video on every screen.
FreeWheel Video Monetization Report, Q3 2015
FreeWheel | November 2015
FreeWheel’s platform for video ad management and monetization helps the largest players in the premium video industry generate revenue from their ad-supported content on desktop, mobile, OTT, and traditional set-top box devices. The dataset used for this report is one of the largest available on the usage and monetization of premium, rights managed video content, and comprised of over 125 billion video views in 2014.
FreeWheel Video Monetization Report, Q2 2015
FreeWheel | August 2015
FreeWheel’s platform for video ad management and monetization helps the largest players in the premium video industry generate revenue from their ad-supported content on desktop, mobile, OTT, and traditional set-top box devices. The dataset used for this report is one of the largest available on the usage and monetization of premium, rights managed video content, and comprised of over 125 billion video views in 2014.
FreeWheel Video Monetization Report, Q1 2015
FreeWheel | May 2015
FreeWheel’s platform for video ad management and monetization helps the largest players in the premium video industry generate revenue from their ad-supported content on desktop, mobile, OTT, and traditional set-top box devices. The dataset used for this report is one of the largest available on the usage and monetization of premium, rights managed video content, and comprised of over 125 billion video views in 2014.
OOYALA: Q4 Global Video Index Report
OOYALA | March 2015
OOYALA powers online video for more than 1,000 customers and reach viewers in every corner of the world, from Argentina to Zimbabwe. This report reveals insight into video views on PCs, smartphones, tablets and smart TVs.
Innovid Interactive Video Benchmarks
Innovid | March 2015
Innovid analyzed thousands of interactive and pre-roll video campaigns, over billions of impressions, from 2014 to set this year’s performance expectations. These metrics will help you understand how various ad formats, publisher placements and ad lengths perform with respect to time earned, activity rate, engagement rate, completion rate, and much more. This report also introduces new benchmarks for cross-device campaigns.
FreeWheel Video Monetization Report, Q4 2014
FreeWheel | February 2015
The FreeWheel Video Monetization Report is released quarterly and seeks to highlight the changing dynamics of how enterprise-class content owners and distributors are monetizing professional digital video content.
Quick Guide To Youtube, Facebook Video & Vine
Tubular | February 2015
Tubular constantly analyzes the most cutting-edge video trends. With the rise of Facebook Video and Vine, they sought to compare the two emerging platforms to YouTube and provide you with content and distribution recommendations.
eCommerce
Global Commerce Review
Criteo | Q1 2018
This report analyzes browsing and purchasing data from over 5,000 retailers in more than 80 countries and indicates today’s shoppers are making on-the-go purchases, and are active across all browsing environments.
Foot Traffic Report & Driving Trends: For the Fuel & Convenience Retailing Industry
GasBuddy and Cuebiq | Q1 2018
GasBuddy and Cuebiq examined more than 32.6 million consumer visits to fuel and convenience retailers between January 1 and March 31, 2018. This data provides actionable insights into consumer behavior and the factors that influence foot traffic.
Foot Traffic Report & Driving Trends: For the Fuel and Convenience Store Industry
GasBuddy and Cuebiq | Q4 2017
GasBuddy and Cuebiq examined 121 million consumer trips to convenience and fuel retailers in 2017—with 35 million visits taking place between October 1 and December 31. This data provides insights into consumer behavior that will continue to be relevant throughout 2018.
Cuebiq Football Attribution Benchmark
Cuebiq | 2017
Now, more than ever, attribution, and the understanding of which ads impact consumer behavior and how, is a priority. In 2017, 57.1% of marketers will spend time examining cross-channel measurement and attribution. But these questions aren’t answerable using online data alone, especially when 93% of consumer spending still takes place offline. This whitepaper will take a closer look at how marketers can implement these metrics and leverage footfall attribution into their campaign analysis.
Foot Traffic Report: For the Fuel and Convenience Store Industry
GasBuddy and Cuebiq | Q1 2017
As the convenience store industry adapts to meet customer needs and grow market share, location intelligence is becoming increasingly critical to understanding consumer habits and behaviors. GasBuddy and Cuebiq teamed up in the first quarter of 2017 to issue the first foot traffic report for the fuel and convenience store industry.
Shoppers Gobble Up In-Store Black Friday Deals on Mobile
Think with Google | Nov 2016
Store foot traffic surged on Black Friday compared to an average weekend day in November, with electronics, clothing, and toy stores seeing some of the biggest jumps. Black Friday also had the highest number of mobile shopping searches, with Thanksgiving coming in a close second.
A Marketer’s Guide to Holiday Supershoppers
Think with Google | October 2016
People around the world have transformed into supershoppers seemingly overnight, thanks to instant access to unlimited inspiration and information. Think with Google uncovered the traits that define this new supershopper. Here’s how to capture their attention this holiday season.
Skimlinks Holiday 2016 eCommerce Report
Skimlinks | October 2016
In the Holiday 2016 eCommerce Report, Skimlinks looked at their network’s data from the past three years across publishers and merchants to see just how integral Black Friday and the Thanksgiving weekend have become to succeeding in the holidays on either side of the Atlantic. They also looked at December and how two of their merchants, in the UK and the in US, are responding to the challenge of Black Friday and adapting their strategy for success.
Email Marketing
Q4 2016 Email Benchmark Report
Experian | January 2017
Download the Q4 Email Benchmark Report to get an in-depth look at the most important marketing trends from Q4.
Q3 2016 Email Benchmark Report
Experian | December 2016
The Q3 2016 Email Benchmark Report provides an in-depth look at the most important marketing trends from Q3. Learn how optimized abandon cart trigger messages can increase transaction rates during the hustle and bustle of the holiday shopping season and more.
Fraud
Advertising Fraud in Mobile Apps
Sizmek Research | 2016
Before you make another mobile ad buy, read this important new research report from Sizmek. Advertisers are wasting a lot of ad spend on fraudulent, illegal, unstable, or otherwise low quality apps, and following a few simple recommendations can help save you big bucks. This report will give you a clear understanding of the problem, what it means for advertisers, and what you can do to protect your buy and your brand.
Header Bidding
Understanding Auction Dynamics: A Primer
PubMatic | 2017
As brand spend and premium content proliferate the programmatic space, themes of transparency have risen to the forefront of the conversation around programmatic. At its core is the need for understanding and control, particularly around how auctions work. To shed light onto this complex and increasingly important topic, this white paper covers how the rules of access to supply are changing, the complex debate around auction types and integration methods, how floors and fees affect SSP and DSP behaviors, and more.
Innovation
Methods to Empower In-Content Advertising Innovations
Mirriad | 2018
Advances in advertising technology have paved the way for new ad formats that allow advertisers to deliver branded messaging and products through in-video advertising, inserting commercial and brand messages into video content itself. While product placement is as old as television itself, AI and computer vision technology are transforming this ad format to allow in-video advertising to be integrated at unprecedented scale. This whitepaper explores aspects of the format in more detail.
Location-based Marketing
State-by-State Guide to Cannabis Advertising
Vana | 2020
The Cannabis industry is a high growth opportunity in the digital advertising ecosystem. Taking advantage of this new revenue stream and audience requires understanding and adhering to complex and ever-changing state regulations. To help navigate this challenging landscape, Vana has created a comprehensive State-by-State Guide to Cannabis Advertising, which includes insights on:
- Where Cannabis and CBD advertising is legal, illegal, or requires state approval
- Cannabis and CBD advertising regulations by state with legal, medical or recreational cannabis programs
- Best practices to follow and what to avoid when advertising a Cannabis and CBD brand
Transforming Customer Engagement With Location-Based Technologies
Future Stores and Blis | 2017
Today, retailers are trying to figure out how to make the store more relevant. Even as retail activity has shifted to online channels, retailers are pivoting their in-store strategies, blurring the lines between digital and physical environments to create a seamless experience for customers. Beginning with offerings like ‘buy online, pick up in store,’ digital has now become an environment for customer engagement that drives in-store sales; and as retailers begin leveraging smart technologies like machine learning, Artificial Intelligence (AI), and Internet of Things (IoT), retailers will not only target and personalize for their consumers, they will “know” them well enough to take advantage of every natural step towards a purchase.
Foot Traffic Report & Summer Driving Trends for the Fuel & Convenience Store Industry, Q3 2017
Cuebiq and GasBuddy | 2017
Between July 1 and September 30, GasBuddy and Cuebiq examined 33.4 million consumer trips to the pumps and convenience stores. This quarter saw some shifts in consumer behavior, with the summer season leading to road trips and frequent driving.
Completing the Customer Journey The Importance of Location Data in Mapping Online and Offline Consumer Behaviors
Cuebiq | 2017
Since the arrival of mobile phones and smart phones we’ve learned to imagine the potential for connecting a consumer’s location with the products, stores, and services that appeal to them. Want to send a discount coupon for lunch at a nearby restaurant? Send an alert. Promote shoes on sale at the local mall? Send an alert. Remind a driver it’s time for an oil change as they drive by your car dealer? Send an… you get the idea. But the overt use of location data to say “Hey, I see you there” scores high on the creepy meter, even if the customer gets value out of being interrupted with advertising and promotions that are relevant and timely to them.
Foot Traffic Report for the Fuel & Convenience Store Industry, Q2 2017
Cuebiq and GasBuddy | 2017
Between April 1 and June 30, GasBuddy and Cuebiq examined 22.6 million consumer trips to the pumps and convenience stores. This quarter saw some shifts in consumer behavior, with the warmer weather giving a boost to weekend travel and visit frequency.
Cuebiq Football Attribution Benchmark
Cuebiq | 2017
Now, more than ever, attribution, and the understanding of which ads impact consumer behavior and how, is a priority. In 2017, 57.1% of marketers will spend time examining cross-channel measurement and attribution. But these questions aren’t answerable using online data alone, especially when 93% of consumer spending still takes place offline. This whitepaper will take a closer look at how marketers can implement these metrics and leverage footfall attribution into their campaign analysis.
Machine Learning
Navigating Liquidity in a Complex World
Facebook | July 2020
Understanding Liquidity: How machine learning helps media teams work smarter
Facebook | May 2019
Machine learning uses algorithms to determine trends and relationships within a dataset, which can be used for explaining observed effects or predicting future outcomes in real time. Systems based on machine learning are able to evaluate opportunities faster than any human being possibly could. In advertising, machine learning allows media teams to automate the more tedious parts of their jobs, like deciding which calls to action work best for which audience, where to serve the ads and when.
Management
The Nielsen CMO Report 2018: The Roadmap for Marketers Who Lead
Nielsen | June, 2018
Driving brand growth through marketing has never been more important—or more complex. With this in mind, Nielsen launched the first in an annual series of CMO reports. Nielsen’s research, based on in-depth interviews and extensive survey data, is a look into the minds of today’s CMOs as they tackle the challenges of an increasingly fragmented marketplace. Across nearly all business verticals, marketers reported large shifts in how they evaluate, measure and budget across media channels. CMOs made it clear that it’s not more data they’re looking for, rather better insight.
Mobile
PubMatic Quarterly Mobile Index (QMI)
PubMatic | Q2 2018
This report identifies key trends in mobile advertising with several benchmarks around pricing, volume and growth. This quarter’s report shines a spotlight on opportunities for in-app advertising and provides helpful statistics on Q2 mobile trends.
Field Guide To Mobile Video Advertising
SpotX | 2018
If you’ve been in the digital advertising industry for some time, you’ll remember hearing that ‘this is the year of mobile’ for more than a few years. In fact, a quick web search will find references to every year since 2007 being the year of mobile according to one media outlet, pundit or another. Looking back on the last 10 years, it’s pretty clear that while there may not have been any one particular year that mobile owned, with hindsight you can argue that this has been the ‘decade of mobile.’
PubMatic Quarterly Mobile Index (QMI) for Q4 2017
PubMatic | 2018
In the Q4 2017 report, they have expanded their scope from quarterly analysis to a full year look back and have added several benchmarks for mobile advertising performance around pricing, volume and growth.
The State of Mobile Video Advertising
InMobi | 2018
Over the past few years, user consumption patterns have undergone significant transformation. People have moved away from desktops and have embraced the ease and convenience of mobile devices. Today’s advertisers demand increased metrics to ensure unprecedented levels of transparency and efficiency in their campaigns. By embracing video that is custom-tailored for the mobile device and also the behavior of a mobile user, advertisers are now able to achieve superior performance that only video can deliver.
Outperform And Outdeliver: Building Brand Love With Mobile
Oath | 2018
What makes someone wait overnight in line for a pair of sneakers? Tattoo a tagline on their bicep? Or make a brand logo the wallpaper on their smartphone? It’s called “brand love”—a connection that’s deeper than just regularly buying products from a brand. It’s about identifying with it. Brand love is something every brand wants, but not every brand gets.
PubMatic Quarterly Mobile Index (QMI) for Q3 2017
PubMatic | 2017
The Q3 2017 QMI report identifies five key trends that emerged in the third quarter of the year. Major themes include rising header bidding monetization opportunities worldwide, the increasing popularity of mobile private marketplaces (PMPs), video ads spreading globally and into mobile, and the alignment of Back-to-School mobile advertising patterns with overall spending trends.
Quarterly Mobile Index
PubMatic Q2 2017
PubMatic’s Quarterly Mobile Index (QMI) report was created to provide both publishers and advertisers with key insights into the mobile advertising industry. By analyzing the billions of digital impressions that flow each day through PubMatic’s platform, SEVEN, we can observe real-time developments in the mobile space that may allude to broader digital industry trends. We can then compare this information to other published data to further understand changes in the mobile landscape.
Note that directional data might not be comparable with prior reports
Pursuing The Mobile Moment
Verve| 2017
Pursuing The Mobile Moment, a June 2017 commissioned study conducted by Forrester Consulting on behalf of Verve, presents new research into how mobile advertisers in North America use location data — how it informs their advertising efforts, what challenges they face, and what benefits they receive.
Foot Traffic Report for the Fuel & Convenience Store Industry, Q2 2017
Cuebiq and GasBuddy | 2017
Between April 1 and June 30, GasBuddy and Cuebiq examined 22.6 million consumer trips to the pumps and convenience stores. This quarter saw some shifts in consumer behavior, with the warmer weather giving a boost to weekend travel and visit frequency.
Cuebiq Football Attribution Benchmark
Cuebiq | 2017
Now, more than ever, attribution, and the understanding of which ads impact consumer behavior and how, is a priority. In 2017, 57.1% of marketers will spend time examining cross-channel measurement and attribution. But these questions aren’t answerable using online data alone, especially when 93% of consumer spending still takes place offline. This whitepaper will take a closer look at how marketers can implement these metrics and leverage footfall attribution into their campaign analysis.
Meet the New Movement in Mobile
AOL | May 2017
Infographic
This year, mobile is all about video. So what do marketers need to know in 2017? AOL has the insights to drive your next big moves. It’s time to hang up last year’s strategies and mindsets and catch up with consumer expectations. That means mobile-first, video-led, and good data applied every step of the way.
Foot Traffic Report: For the Fuel and Convenience Store Industry
GasBuddy and Cuebiq | Q1 2017
As the convenience store industry adapts to meet customer needs and grow market share, location intelligence is becoming increasingly critical to understanding consumer habits and behaviors. GasBuddy and Cuebiq teamed up in the first quarter of 2017 to issue the first foot traffic report for the fuel and convenience store industry.
PubMatic Quarterly Mobile Index (QMI) for Q1 2017
PubMatic | May 2017
The Q1 2017 QMI report identifies six key trends that emerged in the first quarter of the year, including highlights around the increased global adoption of header bidding and private marketplaces (PMPs) as well as growth in mobile video and app inventory, and what these trends mean for publishers and advertisers alike.
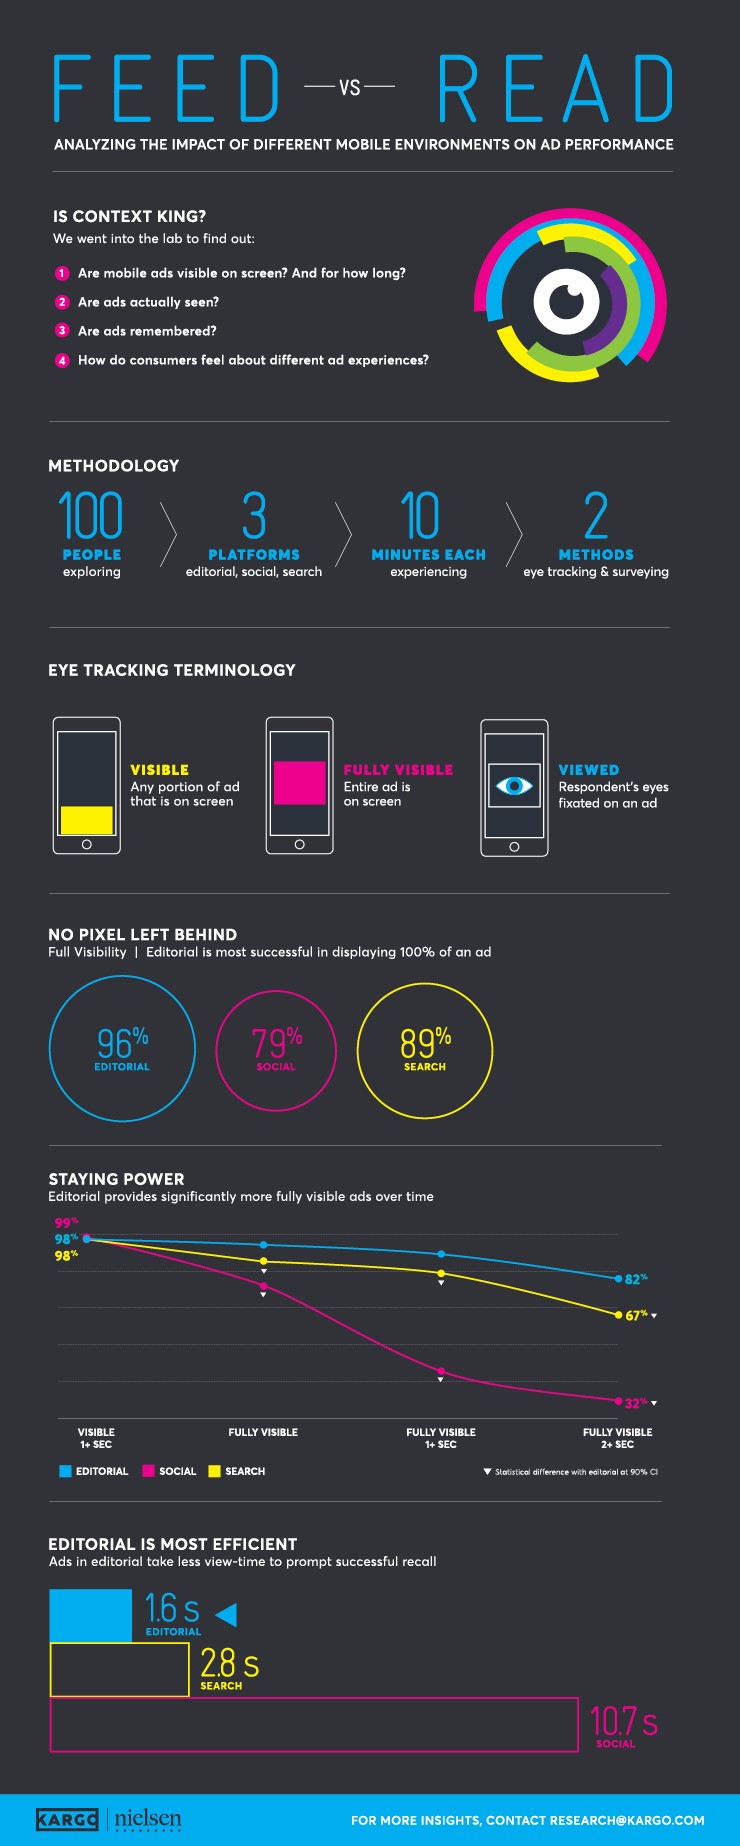
Feed vs. Read: Is Context King?
Kargo | March 2017
Download the infographic
Analyzing the impact of different mobile environments on ad performance.
The New Prerequisite for Brand Loyalty: Make Your Customers Feel Loved
Signal | February 2017
It’s the Age of the Customer, the era of the Internet of Me. Brand names and physical footprints are no longer the decision-drivers they once were. Consumers have turned their trust to whatever they can pull up on their smartphones, from peer reviews to best-selling item rankings. What does this mean for B2C marketers in industries like retail, travel, and gaming/entertainment? Let’s take a look at three significant findings from new research by Wunderman that highlights what today’s empowered consumers expect from the brands they do business with, and as a result, why marketers must totally rethink their approach to customer interactions.
Transparent, efficient, and universal: making the case for open sourcing software
Integral Ad Science | January 2017
With mobile expected to account for nearly 80% of digital ad spend by 2020, achieving industry scale for independent media quality measurement on in-app inventory is a top priority in digital advertising. Integral Ad Science set out to understand the market challenges and identify what it would take to deliver third-party verification at scale for their customers and partners. In opening a dialogue across the digital advertising community, IAS learned that the best solution was to open source their proprietary software. This report delves into the market challenges of measuring viewability in-app and the advantages of open sourcing for the industry.
Answering the Call for Better Mobile Advertising Experiences
Yieldmo | December 2016
Our findings suggest that both advertisers and publishers need to develop mobile ad experiences of a consistently higher quality. By focusing on better ad experiences for consumers, advertisers can increase brand recall while reaping the added benefits of higher brand favorability and purchase intent. Publishers can also capitalize on more user-friendly ad experiences by improving the favorability of their brand. And that may just lead to more loyal readers.
Shoppers Gobble Up In-Store Black Friday Deals on Mobile
Think with Google | November 2016
Store foot traffic surged on Black Friday compared to an average weekend day in November, with electronics, clothing, and toy stores seeing some of the biggest jumps. Black Friday also had the highest number of mobile shopping searches, with Thanksgiving coming in a close second.
How Mobile Has Redefined the Consumer Decision Journey for Shoppers
Google | 2016
Mobile has forever changed the way people shop. A shopper’s smartphone is there for them anytime, anywhere in countless micro-moments. The question for retailers is: Are you prepared to meet these shoppers in the moments that matter most? Explore this guide—full of new research on consumer trends—to find out how to be there and be useful in this new digital landscape.
Multicultural
The Marketer’s Guide to Hispanic Millennials
Viant | July 2017
There are 24 million Hispanic Millennials in the United States, comprising 40% of the total U.S. Hispanic population. Hispanic Millennials are no longer a small sub-segment of the U.S. economy, they are a driving force. Viant’s new report, The Marketer’s Guide to Hispanic Millennials, provides a multidisciplinary look at this bicultural group, with insights on how Hispanic Millennials interact with brands on social media, who their biggest influencers are, what TV shows they watch, and more.
The Nielsen Comparable Metrics Report
Nielsen | March 2017
The Q2 2016 Nielsen Comparable Metrics Report is an in-depth study of users and usage – averaged across the U.S. population – with the purpose of aligning methodologies and metrics to display an “apples to apples” view of consumption across TV, Radio, TV-connected devices, PCs, Smartphones, and Tablets. The core purpose of this report is to address three basic concepts equally applicable to all categories of media measurement: how many, how often, and how long.
POPSUGAR Insights – Hypercultural Latinas
POPSUGAR | 2015
How identity, influence, and lifestyle content impact brand affinity
Tips for Building a Successful Marketing Approach to the Multicultural B2B Segment – a PM3 – NAPA Auto Parts Case Study
MMR | July 2015
Not only are multicultural business owners becoming a larger part of the B2B market, but Hispanic owned businesses represent the largest multicultural B2B segment and the fastest growing ethnic B2B segment.
Latino Power Shift
Nielsen | October 2013
This report, produced by Nielsen using demographic and behavioral data gathered from various sources, demonstrates the rising prominence of Latinas as head of households, key decision makers and primary wage earners among US families.
The African-American Consumer Report: 2013
Nielsen and National Newspaper Association | January 2013
With a current buying power of $1 trillion that is forecasted to reach $1.3 trillion dollars by the year 2017, the importance of connecting with African-American consumers is more important than ever. Importantly, these consumers are distinct from other consumer groups, and understanding this group is critical to making lasting connections.
Android Speaks Spanish, But Brands Don’t Speak Android
Flurry | January 2013
Hispanic agencies need to figure out how to create great brand experiences on Android. If they can, it opens up opportunities well beyond U.S. Spanish speakers.
Native Advertising
Stay on Point
PulsePoint | Q1 2016
In a world where we are inundated by ad messages and digital noise, content marketing helps brands build a relationship- versus a one night stand- with audiences. But how do you find the right audience? How do you take your brand messages to the next level? How do you attract audiences to your content? How do you MAKE ADS MATTER?
Creative Best Practices: Native Ads
Yahoo | October 2015
This document outlines findings from a study done by Yahoo (800 consumers, 4,800 ad exposures) on the topic of consumer perceptions of native ads with creative benchmarks of what works and what doesn’t in terms of disclosure statements and icons, brand logo presence, size of logo as well as recall information and brand mentions for native video ads. It also provides some learning on consumer interaction with autoplay vs. user initiated native video ads showing differences on measures such as Aided Recall, Brand Familiarity and Brand Affinity. While this study featured ad formats from Yahoo only, there are insights here that the industry can take to heart in terms of questions that should be asked when evaluating native ad performance.
Inside Native Advertising
TripleLift | December 2014
This document provides a “state of native” based on recent information about market size, native types and consumer and marketer perceptions compiled from many sources including: Harvard Business Review, Yahoo Research, Rubicon Project, Business Insider Intelligence, TripleLift/Sticky, IAB/Edelman, Digiday, and 3M. The piece ends with some helpful tips and take-aways for anyone involved with or considering native advertising campaigns as part of their digital marketing mix.
Online Marketing
In-Flight Viewing: How Marketers Can Land Travel Audiences Across YouTube, Facebook, and Instagram
Pixability | 2018
Nothing transports a consumer like video — and travel content is booming on YouTube, Facebook, and Instagram. Consumers are turning to video for packing help and travel tips, as well as to experience new places, compare travel options, and ultimately make brand decisions.
Welcome to Contextual 2.0
GumGum | 2018
Contextual targeting, where ads online are targeted to people based on the context of what they’re looking at on page, is looking not just appealing but also safer. Triggered not only by the European privacy law GDPR but also increasing privacy concerns due to behavioral tracking globally, a soaring demand for personalized marketing strategies and the rise of mobile usage, contextual advertising is making a resurgence. View the video.
Theorem 2018 Mid-Year Market Trends and Insights Report
Theorem | 2018
The market is constantly evolving, making it even more important for publishers to stay ahead of trends and changes and to meet advertisers expectations in order to stay relevant. This report will look at the key topics, trends, and areas of change in the digital media market, including a forecast of budget spend across platforms and ad formats, an outlook on digital audio, the current state of brand safety, fraud, and data transparency, and emerging technology in the digital market.
Tomorrow’s News 2018–The global trust landscape: publishers vs. platforms
Reuters | 2018
The third annual Tomorrow’s News survey reveals executives think platforms should do more to combat fake news, are increasingly skeptical of social media and blame brands for ads placed alongside inappropriate content – but they increasingly see news brands as a source of trusted content.
Closing the CMO-CFO Digital Divide: Why Digital Marketers Who Build Trust With Their CFOs Will Succeed
Viant | 2018
With digital marketing spend in the U.S. alone expected to climb as high as $120 billion by 2021, it’s no surprise CFOs can be a bit wary of the cost of a company’s marketing efforts. But they don’t have to be.
Understanding Auction Dynamics: A Primer
PubMatic | October, 2017
As brand spend and premium content proliferate the programmatic space, themes of transparency have risen to the forefront of the conversation around programmatic advertising. At its core is the need for understanding and control, particularly around how auctions work.
Stay ahead of your marketing game: H1 2017 Media Quality Report
Integral Ad Science | H1 2017
The H1 2017 Media Quality Report includes highlights of the state of media quality in global online advertising across display and video inventory, and multiple media metrics. This guide provides key insights based on the hundreds of billions of impressions analyzed monthly in H1 2017. The goal is to help customers and partners better understand their campaigns’ ability to influence consumers and provide them with the data they need to invest with confidence.
Adoption vs execution: How media agencies across the globe are making the most of their DMPs’ capabilities
ExchangeWire Research, in association with Lotame | 2017
Within this report they explore how some agencies are pushing the boundaries and using their DMP beyond data unification, audience targeting and analytics; pushing into customer experience, creative and offline media. ExhangeWire exposes the cultural and technological influences behind these differences and provide actionable insights to take your data strategy to the next level.
H2 2016 Media Quality Report
Integral Ad Science | 2016
In the H2 2016 Media Quality Report you will find highlights of the state of media quality in global online advertising across display and video inventory, and multiple media metrics. This guide provides key insights based on the hundreds of billions of impressions analyzed monthly in H2 2016.
Cuebiq Football Attribution Benchmark
Cuebiq | 2017
Now, more than ever, attribution, and the understanding of which ads impact consumer behavior and how, is a priority. In 2017, 57.1% of marketers will spend time examining cross-channel measurement and attribution. But these questions aren’t answerable using online data alone, especially when 93% of consumer spending still takes place offline. This whitepaper will take a closer look at how marketers can implement these metrics and leverage footfall attribution into their campaign analysis.
The State of the Media Industry
Ooyala | 2017
Ooyala’s State of the Media Industry 2017 report highlights the astonishing growth numbers for global video views and revenues.
The Nielsen Comparable Metrics Report
Nielsen | March 2017
The Q2 2016 Nielsen Comparable Metrics Report is an in-depth study of users and usage – averaged across the U.S. population – with the purpose of aligning methodologies and metrics to display an “apples to apples” view of consumption across TV, Radio, TV-connected devices, PCs, Smartphones, and Tablets. The core purpose of this report is to address three basic concepts equally applicable to all categories of media measurement: how many, how often, and how long.
2017 U.S. Cross-Platform Future in Focus
comScore | March 2017
Amidst a backdrop of TV and digital convergence, the demands on marketers and media companies to understand how the media landscape is evolving have never been greater.
Making Omnichannel Marketing Work
Nielsen | August 2016
Marketers face the difficult job of managing media fragmentation, handling data overload, consolidating disparate data sources and avoiding organizational misalignment. One of the biggest challenges, however, lies in understanding cross-channel customer data and using this information to develop fully integrated media and content marketing plans. Without this, marketers risk turning off customers and prospects with the wrong messages at the wrong times on the wrong devices. If you’re not developing advertising and content that truly resonates with customers across the consumer journey then you’re wasting your marketing dollars.
How Micro-Moments Are Reshaping the Travel Customer Journey
Google | July 2016
Travelers increasingly turn to mobile in real time and on-the-go, making informed decisions faster than ever before. For marketers, this means there are new opportunities to connect throughout the entire travel customer journey, across devices and channels. Explore this guide—full of new research on consumer trends—to find out how to be there and be useful for travelers in this new digital landscape.
Personalized Display Ads Beat Google Rich Media Benchmark by 3x
Jivox | 2016
Personalized advertising enables brands to engage individual consumers in increasingly more relevant and timely ways. Viewed as the future of marketing, personalization has become a top priority for brand marketers as they face heightened pressure to tie advertising spend to revenue. While early indications suggest anecdotally that consumers vastly prefer personalized ads, for the first time the impact of personalization on digital ad performance has been quantitatively measured. As this Benchmark Report shows, consumer engagement skyrockets when display ads are personalized, and even the simplest triggers deliver enormous performance gains.
The Halo Effect: How Advertising on Premium Publishers Drives Higher Ad Effectiveness
comScore | 2016
comScore published a research study that found that premium publishers delivered significantly better branding effectiveness results for advertisers across a number of measures. The primary driver of this increased effectiveness is the halo effect that comes from the value of the contextual environment in which these ads are seen.
The State of Influencer Marketing
CrowdTap | 2016
To help marketers modernize their approach to influencer marketing, Crowdtap interviewed more than fifty creators to capture their candid thoughts on the state of brand-creator partnerships. The results reveal actionable takeaways for brands and agencies working to capture consumer attention via influencer marketing.
The Marketer’s Guide to User Generated Content
CrowdTap | 2016
This report aims to shed light on the rapidly evolving user-generated content landscape and provide tangible best practices for marketers navigating this new terrain. You’ll see that we’ve also provided some research around the impact of consumer-led stories, and even asked a few of our friends in the industry to weigh in with their own opinions on the state of UGC.
FreeWheel Video Monetization Report, Q3 2015
FreeWheel | November 2015
FreeWheel’s platform for video ad management and monetization helps the largest players in the premium video industry generate revenue from their ad-supported content on desktop, mobile, OTT, and traditional set-top box devices. The dataset used for this report is one of the largest available on the usage and monetization of premium, rights managed video content, and comprised of over 125 billion video views in 2014.
PubMatic Quarterly Mobile Index
PubMatic | Q3 2015
By analyzing the billions of daily impressions that flow through the platform, PubMatic is able to observe real-time developments in the mobile space that allude to broader digital industry trends.
Display Advertising: Quarterly Performance Report
Celtra | Q3 2015
Overview of campaigns running in Q3.
Real-Time Data Analytics: Empowering Publishers to Make Better, Faster Decisions
September 2015
PubMatic
As the number of screens and ad impressions continue to proliferate, advertising dollars are moving from traditional to digital environments at a staggering rate. The key to capturing share of the growing digital spend comes down to the ability for publishers to leverage real-time data. According to a commissioned study conducted by Forrester Consulting on behalf of PubMatic, 67 percent of publishers – large and small – believe that real-time data is important to their efforts, and 62 percent find that it leads to an increase in revenue, yet only 27 percent report receiving data in real-time.
Tips for Building a Successful Marketing Approach to the Multicultural B2B Segment – a PM3 – NAPA Auto Parts Case Study
MMR | July 2015
Not only are multicultural business owners becoming a larger part of the B2B market, but Hispanic owned businesses represent the largest multicultural B2B segment and the fastest growing ethnic B2B segment.
The World’s 50 Most Influential CMOs Study 2015
ScribbleLive, Forbes, and LinkedIn | Q2 2015
This is the Fourth Annual Forbes/ScribbleLive (formerly Appinions) World’s 50 Most Influential CMOs Study in which they identify and recognize the marketing leaders who have established themselves by publishing and sharing opinions that travel and generate significant reactions.
2015 Bad Bot Landscape Report
Distil Networks | May 2015
Whitepages Case Study: The importance of Policies, Data and Disclosures
Many of the current technologies used to detect fraud are great at detecting the amount of fraud, using data collected from the campaigns. We call this post-bid analysis. We need more technologies and techniques that focus on the pre-bid data in order to stop the fraud before it happens. Having continuous, real-time data is important for this; but equally important are the policies of the publishers and the ad networks and the levels of disclosure they offer. These parameters mean the bad guys will self-select out — because they would never provide full disclosure of their data.
FreeWheel Video Monetization Report, Q1 2015
FreeWheel | May 2015
FreeWheel’s platform for video ad management and monetization helps the largest players in the premium video industry generate revenue from their ad-supported content on desktop, mobile, OTT, and traditional set-top box devices. The dataset used for this report is one of the largest available on the usage and monetization of premium, rights managed video content, and comprised of over 125 billion video views in 2014.
POPSUGAR Insights – The Evocative Web (Q1 2015)
POPSUGAR | April 2015
We teamed again with Ipsos OTX to study the impact the rise of the visual web has had on women in the U.S. The study focuses on the the relationship between female consumers, publishers and brand marketers and reveals the emotional benefits of utilizing high quality visual imagery.
POPSUGAR Insights – Find Your Happy (Q1 2015)
POPSUGAR | April 2015
We partnered with Ipsos OTX on a new, multi-generational, research study to measure happiness. The study explores how happy women currently are, what happiness means to her, the areas of her life where she is happy and unhappy and why digital content and technology play an important role in helping her improve her life and find her happy.
OOYALA: Q4 Global Video Index Report
OOYALA | March 2015
OOYALA powers online video for more than 1,000 customers and reach viewers in every corner of the world, from Argentina to Zimbabwe. This report reveals insight into video views on PCs, smartphones, tablets and smart TVs.
Innovid Interactive Video Benchmarks
Innovid | March 2015
Innovid analyzed thousands of interactive and pre-roll video campaigns, over billions of impressions, from 2014 to set this year’s performance expectations. These metrics will help you understand how various ad formats, publisher placements and ad lengths perform with respect to time earned, activity rate, engagement rate, completion rate, and much more. This report also introduces new benchmarks for cross-device campaigns.
ShareThis Finance Study
ShareThis | March 2015
Every month 32 million users generate 68 million social actions related to finance.
Quick Guide To Youtube, Facebook Video & Vine
Tubular | February 2015
Tubular constantly analyzes the most cutting-edge video trends. With the rise of Facebook Video and Vine, they sought to compare the two emerging platforms to YouTube and provide you with content and distribution recommendations.
FreeWheel Video Monetization Report, Q4 2014
FreeWheel | February 2015
The FreeWheel Video Monetization Report is released quarterly and seeks to highlight the changing dynamics of how enterprise-class content owners and distributors are monetizing professional digital video content.
Spotify Brand Impact Story
Spotify | January 2015
The Brand Impact Study was administered by comScore—a global leader in measuring the digital world and a preferred source for digital business analytics—and commissioned by Spotify for Brands—the platform that unlocks audience intelligence to connect brands with the streaming generation—to quantify the impact that music listening has on brands.
AdRoll’s State of the Industry Report
AdRoll | January 2015
Today’s marketers are becoming more like analysts, using technology to understand and react to always-on consumers in real time. It’s only natural that they’ve begun to demand tools that support their vision for a full-funnel, multi-platform, data-driven marketing strategy. Read more about it in AdRoll’s State of the Industry Report.
Q4 2014 Consumer Sharing Trends Report
ShareThis | January 2015
This is the 6th installment of Sharethis Consumer Sharing Trends Report. This quarter they released findings from both Q4/2014 and 2014 overall.
The SMB Guide to Digital Advertising For the Holidays
Adadyn Academy | 2015
A Whitepaper featuring new customer research and programmatic insights for midsize retail marketers.
10 Creative Best Practices
Celtra | 2015
Key guidelines and principles for successful creatives.
From Web Traffic to Foot Traffic: How Brands and Retailers Can Leverage Digital Content to Power In-Store Sales
Cofactor and Altimeter research | 2015
Brands can now communicate with customers in the way they demand, which is to be recognized as unique individuals, with unique histories, preferences and buying behavior. By embracing the one-to-one advertising model instead of one-to-many, brands stand not only to gain foot-traffic into their stores, they are able to gain the all important loyalty of a customer. Through in-depth interviews with marketers from today’s leading CPG and retail brands, the report highlights the efforts companies are making to embrace this vision, as well as the wins they have recorded as a result.
Programmatic
The State of Supply Path Optimization: Progress and Impact in the US
PubMatic | 2019
With the dizzying choices of inventory paths and multiple supply partners, programmatic buying became increasingly complex, and less transparent. Amidst demands to improve supply chain efficiency and improve the value technology partnerships, Supply Path Optimization (SPO) has come to the forefront of the programmatic industry dialogue. While it is widely embraced, buyers’ tactics and motivations are varied. How are buyers approaching SPO? What are the biggest benefits and concerns around optimization? How does SPO impact SSP relationships? What does SPO look like, essentially?
To answer these questions, PubMatic partnered with Digiday to survey and interview advertisers, agencies and demand-side platforms (DSPs) to gain first-hand insight into the state of supply path optimization.
Understanding Supply Path Optimization (SPO): A Primer
PubMatic | 2019
As more brand spend continues to flow through automated, programmatic pipes, the buying community has been pushing for increased quality and transparency across the supply chain. This white paper aims to provide more clarity and actionable insights for DSPs, agencies and advertisers interested in implementing supply path optimization (SPO).
Understanding SSP Log-Level Data: What Buyers Need to Know to Become More Efficient
PubMatic | 2019
Partner data, within ad tech, is extremely valuable and there has been an increasing number of conversations around the available types and applicable insights to be gleaned from the information. SSP log-level data, in particular, can be used by buyers to impact their bidding strategies, targeting capabilities and improve their overall inventory quality. By diving into the data, with proper analysis and trusted partnerships, media buyers can further benefit from more informed planning and buying, this improving on advertising spend. This white paper discusses what SSP log-level data includes, why it matters to buyers, and 3 important ways to use the data.
Four Components for Performance Marketers to Become Programmatic
MediaAlpha | 2018
How KAYAK.com Embraced a Programmatic Strategy for its Performance Marketing Efforts Reaching a 120% ROI
Lessons Learned in Header Bidding
PubMatic | March 2016
New Library Illustrates Strategic Opportunity for Programmatic Advertising
IAB Europe | February 2016
The Rise of Creative in a Programmatic World
Celtra | 2015
As marketers move away from a click-centric worldview and look increasingly at engagement, they’re holding their breath to see if new high-touch ad formats will deliver. This new breed of display ads provides a more robust user experience while still adhering to the standards that drive programmatic exchanges
Search
Marketing Trends That Defined Google’s Year in Search
Think with Google | December 2016
Google’s “Year in Search” retrospective highlights the moments that defined 2016. Not only does search activity demonstrate how consumers turn to Google, it also provides valuable insights for marketers—especially as they set their road maps for 2017.
State of Search
Compete | 2016
The State of Search 2016 report provides an overview of key trends influencing the search landscape: such as the rising importance of product listing ads, the interplay of organic search and content marketing, and the value of social media in search.
Local Search: Unleashing Opportunities for National Advertisers
IDC and YP.com | December 2015
Catalyzed by the use of mobile devices, local search is evolving rapidly. Consumer expectations and behavior are changing dramatically compared with patterns established in the desktop-bound Web search domain. View the Infographic.
Social Media
2019 Influencer Marketing Global Survey
Rakuten Marketing | 2019
Influencer marketing has continued to provide advertisers with authentic opportunities to tell their brand story to consumers. By leveraging the creative expression and organically grown audience from an influencer partner, a brand can reach new consumers and cultivate loyalty. To fully understand the importance influencers can have on a brand’s success, Rakuten Marketing helps bridge the gap to better realize the impact influencers have on consumers’ shopping behavior.
The 2019 Topics & Trends Report from Facebook IQ
Facebook | 2018
Review of the topics of conversation on Facebook that grew in 2018 and what they suggest about what will matter to people in the year ahead.
Discover Once-a-Day Moments that Can Grow Your Brand
Facebook | 2018
From the moment they wake, people are sharing and sharing in each other’s lives. With technology, social connections can come together around even the most routine daily activities. And brands can join in and help people celebrate the extraordinary in the ordinary. For marketers looking to build campaigns in addition to the traditional calendars of peak holidays and events, once-a-day moments can offer new category entry points.
In-Flight Viewing: How Marketers Can Land Travel Audiences Across YouTube, Facebook, and Instagram
Pixability | 2018
Nothing transports a consumer like video — and travel content is booming on YouTube, Facebook, and Instagram. Consumers are turning to video for packing help and travel tips, as well as to experience new places, compare travel options, and ultimately make brand decisions.
Q4 2014 Consumer Sharing Trends Report
ShareThis | Janaury 2015
This is the 6th installment of Sharethis Consumer Sharing Trends Report. This quarter they released findings from both Q4/2014 and 2014 overall.
Local Search: Unleashing Opportunities for National Advertisers
IDC and YP.com | December 2015
Catalyzed by the use of mobile devices, local search is evolving rapidly. Consumer expectations and behavior are changing dramatically compared with patterns established in the desktop-bound Web search domain. View the Infographic.
Viewability
Stay ahead of your marketing game: H1 2017 Media Quality Report
Integral Ad Science | H1 2017
The H1 2017 Media Quality Report includes highlights of the state of media quality in global online advertising across display and video inventory, and multiple media metrics. This guide provides key insights based on the hundreds of billions of impressions analyzed monthly in H1 2017. The goal is to help customers and partners better understand their campaigns’ ability to influence consumers and provide them with the data they need to invest with confidence.
Viewability Guide
Integral Ad Science | 2017
Advertising is all about getting your message in front of the right people at the right time, to influence consumer behavior and actions. So, when as much as 50% of digital ads aren’t viewable, it’s no surprise that viewability has become a top concern in the advertising community.